Garbage Collection in JavaScript
Introduction
In general, the garbage collector works like this:
- It identifies “live” and “dead” objects.
- It recycles/reuses the memory occupied by dead objects.
- It compacts/defragments memory (optional).
The definition of live and dead objects depends on “reachability”: in JavaScript, an object is live if it can be reached from a root. Here is a simple example:
var newObject = {a: 1, b: 2}

console.log(window.newObject) //{a: 1, b: 2}
Note: The case of let and const is different, so there are other ways for the GC to identify roots. For this article, we’ll consider the case of var, which is attached to the global window object.
The cost of GC
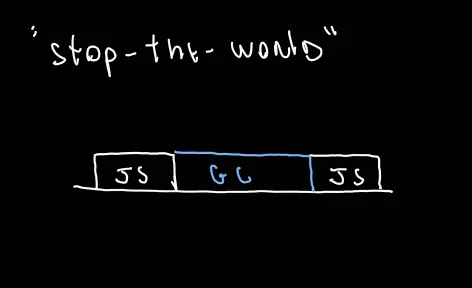
Running the GC comes at a cost: it consumes resources and, consequently, can increase processing time. This strategy is called “stop-the-world”; although it is simple, it needs to use main-thread resources, which can increase latency.
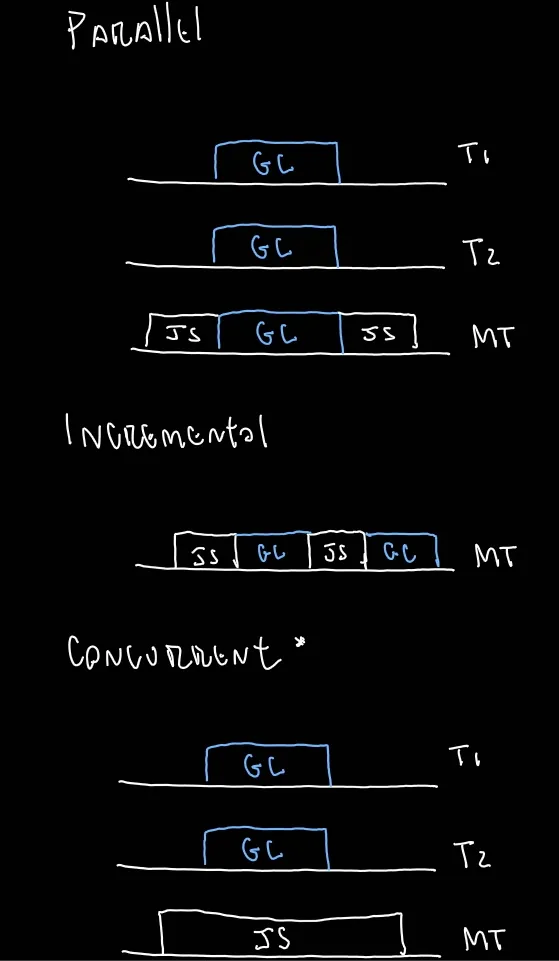
V8 currently supports other GC execution strategies:
Parallel: Helper threads are created to divide the workload evenly among them. This strategy still pauses the main thread, but because the workload is distributed among helper threads, the pause tends to be shorter.
Incremental: It uses only the main thread, but the GC work is divided into smaller chunks throughout the program’s execution. It still takes the same amount of time as “stop-the-world”, but without overloading the main thread. In practice, the perceived latency will be lower. Imagine a video loading on YouTube: small stutters have less impact on the user than a long loading pause, even if the total time is the same. In practice, this strategy may take a little longer because switching back to the JavaScript code being executed can invalidate GC work.
Concurrent: This is when JavaScript code runs on the main thread while the GC runs on helper threads. At first glance, it may seem like the best strategy, but it comes at a cost: it is the most complicated because it faces the same problem as the Incremental strategy, but now with JavaScript code running concurrently—that is, with operations that can generate race conditions.
Attention: This description may sound like the definition of parallel execution. However, in the context of GC, because the helper threads are manipulating the same memory space (the heap), they are considered to be competing for the same resource; therefore, this is concurrency.
Generation Layout
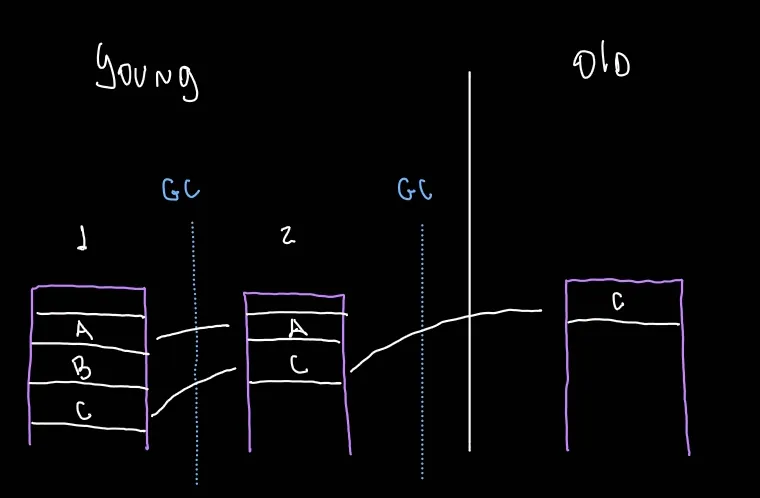
V8 divides the heap into two areas called generations: the Young generation and the Old generation. The Young generation has two additional divisions, Nursery and Intermediate.
The idea is that it is more common to create objects that should be destroyed soon afterward, or at least that this is the expected behavior. Therefore, every object is born in the Nursery of the Young generation. After the first GC cycle, if it survives, it moves to Intermediate; after another cycle, if the object is still alive, it moves to the Old generation. Remember that being alive means being reachable from a root; in this example, that means being reachable from the global window object.
Major GC (Full Mark-Compact)
Consider this code snippet:
var a = {b: 1, c: 2}
var d = {e: 1}

console.log(window.a) //{b: 1, c: 2} - live object
console.log(window.d) //{e: 1} - live object

d = undefined

console.log(window.a) //{b: 1, c: 2} - live object
console.log(window.d) //undefined - dead object
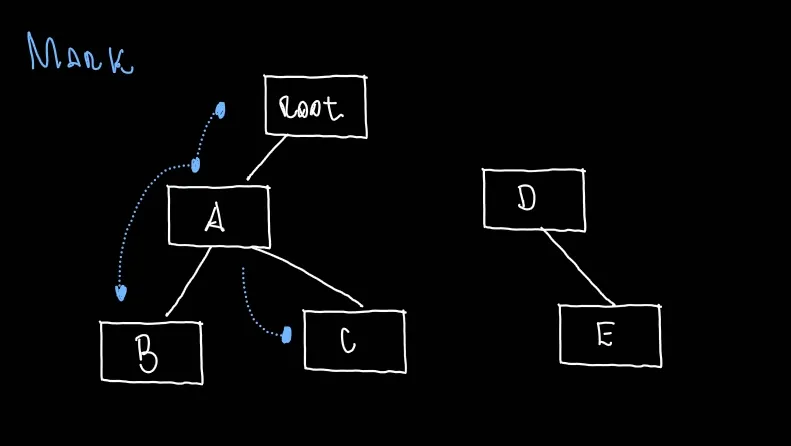
Marking: This is the process of accessing and marking reachable objects. The GC follows pointers, recursively accessing and marking objects at runtime, similarly to traversing a tree, until it has accessed every object.
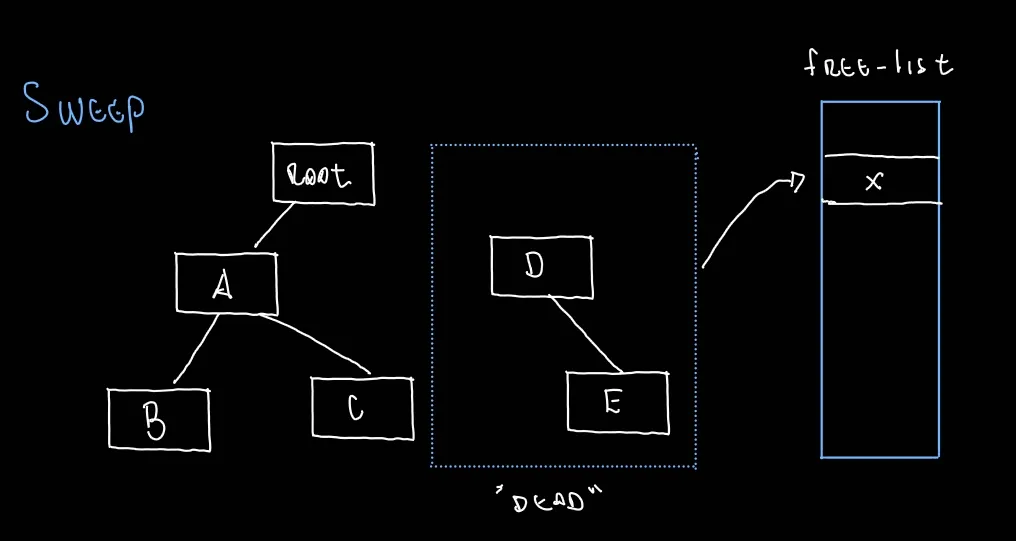
Sweeping: The space occupied by objects that cannot be reached is added to a structure called a free-list. This structure organizes the memory addresses and sizes of the freed regions. When more memory is needed, the free-list is consulted to retrieve a free region of the required size.
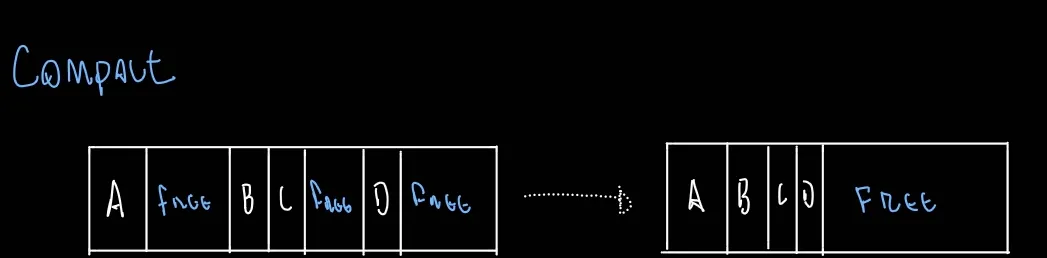
Compaction: This is the process of compacting (and evacuating—moving) used memory by moving live objects into contiguous regions. This reduces fragmentation and groups free space together, allowing it to be reused for future allocations. Free regions can be registered in the free-list and made available to the allocator.
The Major GC begins the Marking process concurrently. When it finishes, it sends the result to the main thread, which validates the Marking and starts Compaction in parallel where possible. The main thread then starts Sweeping concurrently.
Minor GC (Scavenger)
There are two types of GC in V8: Major is applied to the entire heap (Young and Old), while Minor is applied only to the Young generation.
This GC is responsible for moving objects between the two divisions of the Young generation. Because the Young generation is smaller, approximately 16 MB, Minor GC runs more frequently.
The Minor GC uses the parallel strategy, dividing the workload between the main thread and helper threads.
Analyzing the GC trace in practice
Run this code using the –trace-gc flag:
//node --trace-gc gc.js
let maximum = 1_000_000;
const entries = new Set();

const main = () => {
  while (maximum > 0) {
    const obj = {
      timestamp: Date.now(),
      index: maximum,
      message: 'memory using'.repeat(100)
    }
    entries.add(obj);
    maximum --;
  }
}
main();
The output will look something like this:
[55384:0x70480c000] 19 ms: Scavenge 4.4 (5.5) -> 4.2 (6.5) MB, pooled: 0 MB, 0.79 / 0.00 ms (average mu = 1.000, current mu = 1.000) allocation failure;Let’s break down the most important parts of this output:
[55384:0x70480c000] -> [PID: JavaScript heap instance]. 19 ms -> When the phase started; here, it means it started after 19 ms of execution. Scavenge -> Execution phase; in this case, Scavenge is Minor GC. 4.4 (5.5) -> Heap used before GC (total heap before GC), both in MB. 4.2 (6.5) -> Heap used after GC (total heap after GC), again in MB. 0.79 / 0.00 ms -> Time during which JavaScript execution was paused. allocation failure -> The reason that triggered the GC: allocation failure, meaning a new object had to be allocated, but memory was full.
In other lines, we can see something like this:
[55384:0x70480c000] 297 ms: Mark-Compact 206.7 (318.7) -> 186.0 (315.8) MB, pooled: 0 MB, 70.42 / 0.00 ms (+ 0.7 ms in 37 steps since start of marking, biggest step 0.1 ms, walltime since start of marking 73 ms) (average mu = 0.755, current mu = 0.755) finalize incremental marking via stack guard; GC in old space requestedNotice that Mark-Compact, the Major GC, has now run in the Old generation, referred to as old space.
[55384:0x70480c000]       19 ms: Scavenge 4.4 (5.5) -> 4.2 (6.5) MB, pooled: 0 MB, 0.79 / 0.00 ms  (average mu = 1.000, current mu = 1.000) allocation failure;
[55384:0x70480c000]       20 ms: Scavenge 4.4 (6.5) -> 4.4 (9.0) MB, pooled: 0 MB, 0.62 / 0.00 ms  (average mu = 1.000, current mu = 1.000) allocation failure;
[55384:0x70480c000]       22 ms: Scavenge 6.7 (9.5) -> 6.6 (10.3) MB, pooled: 0 MB, 1.42 / 0.00 ms  (average mu = 1.000, current mu = 1.000) allocation failure;
[55384:0x70480c000]       25 ms: Scavenge 6.9 (10.3) -> 6.8 (15.8) MB, pooled: 0 MB, 2.29 / 0.00 ms  (average mu = 1.000, current mu = 1.000) allocation failure;
[55384:0x70480c000]       29 ms: Scavenge 11.2 (16.4) -> 11.1 (16.4) MB, pooled: 0 MB, 1.71 / 0.00 ms  (average mu = 1.000, current mu = 1.000) allocation failure;
[55384:0x70480c000]       30 ms: Scavenge 11.5 (16.4) -> 11.5 (28.2) MB, pooled: 0 MB, 1.29 / 0.00 ms  (average mu = 1.000, current mu = 1.000) allocation failure;
By analyzing the first lines of the trace, we can see that Scavenge (Minor GC) cannot clear the Young generation, since the heap usage values before and after GC are almost the same:
4.4 -> 4.2 4.4 -> 4.4 6.7 -> 6.6
This happens because Minor GC was unable to get rid of the newly created objects. Looking at the total heap after GC, we can see a gradual increase.
6.5 MB -> 9.0 MB -> 10.3 MB -> 15.8 MB
In other words, the objects are being promoted to the Old generation, and Node.js needs to allocate more resources for the heap by requesting them from the operating system.
[55384:0x70480c000] 297 ms: Mark-Compact 206.7 (318.7) -> 186.0 (315.8) MB, pooled: 0 MB, 70.42 / 0.00 ms (+ 0.7 ms in 37 steps since start of marking, biggest step 0.1 ms, walltime since start of marking 73 ms) (average mu = 0.755, current mu = 0.755) finalize incremental marking via stack guard; GC in old space requestedIn plain English, this is where things went south: the amount of allocated memory reached 315.8 MB, and Major GC was triggered.
Now run this version of the code. The difference is that the objects are created but, because they are not added to the Set, they lose their references and therefore do not move to the Old generation. The trace will show only Minor GC executions.
let maximum = 1_000_000;
const entries = new Set();

const main = () => {
  while (maximum > 0) {
    const obj = {
      timestamp: Date.now(),
      index: maximum,
      message: 'memory using'.repeat(100)
    }
    //entries.add(obj);
    maximum --;
  }
}
main();
Conclusion
Once we understand how GC works in Node.js, we can read GC traces and look for memory leaks. In some cases, adjusting the size of each generation (space) can solve the problem. For example, you can test the same code with this flag, which changes the limit of the Young generation (referred to as semi-space).
node --trace-gc --max-semi-space-size=900 gc.jsThe expected result is smaller Minor GC collections and fewer Major GC executions because there is now more total space in the Young generation.
In real-world scenarios, identifying memory leaks will be more difficult, and other techniques for analyzing the application can and should be used. However, understanding how GC works and knowing how to read its trace are fundamental to finding problems.
Note: Some details of the Young generation, such as semi-spaces and write barriers, were left out of this article for simplicity.
Use of AI:
- Grammar correction.
Sources: https://nodejs.org/learn/diagnostics/memory/using-gc-traces https://v8.dev/blog/trash-talk https://nodejs.org/api/cli.html